Blog · September 2024
Using ML/AI to Create a Powerful Location Based Feature for Credit Risk Models
Introduction
With a mission to improve credit risk modeling for consumer loans, and other financial instruments, we turn our attention to how the socioeconomic environment of a borrower's location can influence expected loan performance. Our aim is to introduce a meaningful new feature into the credit risk model: Locality Health Score (LHS).
Developing the Model
We created an ensemble regression model, combining an Evolutionary Model with a Gradient Boosted Tree Model. The models leverage historical the 36-month term Lending Club consumer loan dataset, encompassing hundreds of thousands of loans and their outcomes. Note that all loans studied here were either fully paid off or defaulted, i.e. there were no still active loans in the study.
The ensemble model predicts the percentage of loan principal ultimately repaid (where less than 100% indicates default) based on the origination location of the loan (city and state). While Lending Club had already graded these loans using their proprietary credit risk model, we hypothesized that the socioeconomic characteristics of the originating locations were not fully utilized—and our results confirmed this hypothesis.
Feature Engineering
Our models' features were meticulously derived from the temporal socioeconomic data of the loans' issuing locations. We sourced socioeconomic data from publicly available datasets, including:
- U.S. Bureau of Labor Statistics
- Consumer Financial Protection Bureau
- Equifax (via St. Louis Fed)
- Federal Reserve System
- Google API's & maps (location service)
- Realtor.com (via St. Louis Fed)
- US Census Bureau
- Zillow (courtesy of NASDAQ)
36-Mo Term Loan Performance
We rescaled and normalized the predictions of the ensemble model into percentile rankings, scoring cities and neighborhoods from 0 (suboptimal) to 1 (excellent). This is our Locality Health Score (LHS). Table 1 compares the overall principal loss from loans in cities with higher than median LHS (LHS High) to those with lower than median LHS (LHS Low) for Lending Club 36-month term loans, where the goal was to lower the percentage of defaulted, unpaid principal.
| Term | Year | LHS High | Overall | LHS Low | # High | # Low | Rate High | Overall | Rate Low |
|---|---|---|---|---|---|---|---|---|---|
| 36 | 2012 | 6.78% | 7.98% | 9.16% | 21,330 | 20,755 | 12.92% | 12.98% | 13.04% |
| 36 | 2013 | 5.99% | 7.11% | 8.15% | 48,472 | 49,181 | 12.73% | 12.95% | 13.15% |
| 36 | 2014 | 6.70% | 7.77% | 8.74% | 60,534 | 61,983 | 12.09% | 12.32% | 12.54% |
Table 1 shows the defaults rates and number of loans in each cohort (evenly distributed between low and high LHS scores). In the last three columns of the table we also calculate the overall interest rate assessed by Lending Club for each cohort, which shows a modestly higher interest charged for low LHS loans, but basically demonstrates that each cohort contains similarly graded loans.
Table 1 highlights the significant reverse correlation LHS has versus default rates. For instance, in 2012, loans from higher LHS cities had a 2.38% lower default rate compared to loans from lower LHS cities (6.78% vs. 9.16%), with a 1.18% improvement available by selecting higher LHS loans vs. the overall performance of the loans in this cohort.
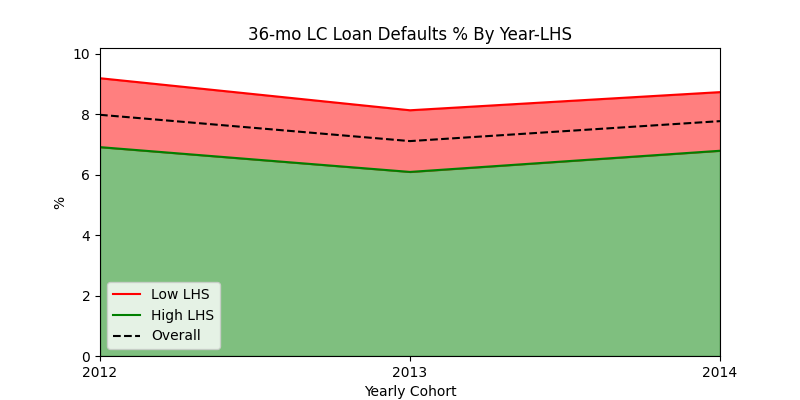
The percentage difference in default rates is visually illustrated in the chart below. The area shaded in red, located below the overall performance dotted line, represents the reduction in default rate when selecting loans from the higher LHS cohort (vs. the overall dataset). This demonstrates the significant improvement achieved by choosing loans from localities with a better Locality Health Score. Alternatively, the interest rate charged on the loans could be adjusted to equalize risk adjusted returns on the loans.
60-Mo Term Loan Performance
We also tested the ensemble model on a test set of 60-month Lending Club loans, which were not included in the training set. The model's effectiveness in sorting loans by expected principal repayment rate demonstrates its robustness, and general applicability to other financial instrument datasets (i.e. the model was not overfit).
In 2012, 60-mo term loans from higher LHS cities had a 2.60% lower default rate compared to loans from lower LHS cities (18.08% vs. 20.68%), with a 1.20% improvement available by selecting higher LHS loans vs. the overall performance of the loans in this cohort.
| Term | Year | LHS High | Overall | LHS Low | # High | # Low | Rate High | Overall | Rate Low |
|---|---|---|---|---|---|---|---|---|---|
| 60 | 2012 | 18.08% | 19.48% | 20.68% | 4,853 | 4,794 | 18.40% | 18.42% | 18.41% |
| 60 | 2013 | 16.09% | 17.36% | 18.52% | 16,847 | 16,902 | 18.08% | 18.10% | 18.08% |
| 60 | 2014 | 17.46% | 18.75% | 19.89% | 25,500 | 25,899 | 17.13% | 17.20% | 17.25% |
Conclusion
Our ensemble model predicts loan performance (% of principal repaid) using optimized features derived from the socioeconomic data associated with the loan issuing cities. We transformed these predictions into a scaled Locality Health Score (LHS), which serves as a powerful new feature for credit risk modeling. The LHS is versatile, with potential applications in various other verticals beyond the credit space, such as finance, insurance, real estate, and marketing.
Next Blog: The Tale of Two Cities: Miami, FL and Corpus Christi, TX